The swimming situation in Salzburg isn’t exactly great. 150k residents share two (!) indoor pool places (one of them often being closed for extended periods of time due to shoddy construction), and there are only two additional outdoor pool places operating during summer months.
For people who like swimming lanes, as I do, there is a grand total of about 16 swim lanes available during summer, and only 10 during winter (if one of the places isn’t closed yet again because the contractor used rust-susceptible screws… for a pool).
The most problematic pool is also the most conveniently located one. Plus, the form-over-function architecture looks amazing. If you look past the parking garage that only got an entry several months later, the steep pricing changes, the fact it took months to find a solution to the rusty screws that is not a web to protect people from falling debris, people filming, and the sexual harassment, it’s a pretty nice place to swim and sweat.
The specific day-to-day issues I face are:
- The swim lanes are so popular that you usually have to share with 2-4 people, which has about a 50:50 chance of going well.
- Clubs, schools, and underwater gymnastics occupy much of the available space.
- There are so few sauna places in Salzburg that I’ve been turned away at the door more than once due to the place being at capacity.
How to fight these issues?🔗
Complaining doesn’t go far, so I’m looking for things that I can do without relying on anyone else.
The social angle🔗
The first step was pretty simple: I asked the front desk for a schedule of events that lead to increased occupancy and lane reservations.
I listed a lot of bad stuff above, but all the employees I’ve interacted with so far have been amazing people. Friendly, and eager to help, they gave me all I needed to know without a fuzz.
Now I know specific days and times (Tuesday noon and evening) to avoid based on schedule, but it doesn’t cover the dynamics of individual visits.
The technical angle🔗
Essentially, I want to avoid going there if there are many people, but how to tell before going?
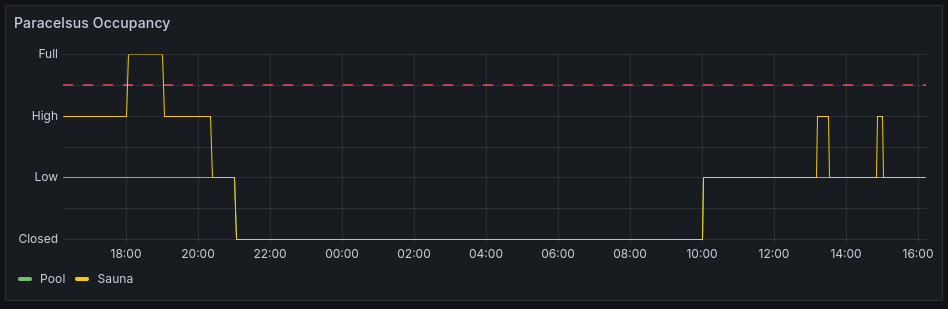
The official website provides coarse occupancy information for pool and sauna separately, which has the states closed, low, high, and full. Of course, there is no API for that, and they don’t offer historic data.
It’s scrape-o-clock - let’s go!
The occupancy markup looks like this:
<div class="flyin flyin-badge">
    <span class="d-md-none">Occupancy rate:</span>
    <div class="d-flex align-items-center d-md-inline-block">
        <button type="button" class="status-light status-low js-flyin__trigger" data-flyin-target-id="#bath" aria-controls="bath" aria-expanded="false" aria-haspopup="dialog">
            <span class="status-light__circle"><span class="status-light__circle-inner" aria-label="gering"></span> </span>
            <span class="status-light__text d-none d-md-inline-block">Occupancy rate bath</span>
            <span class="status-light__text d-md-none">Bath</span>
            <span class="icon icon-arrow-right status-light__arrow"></span>
        </button>

        <button type="button" class="status-light status-low js-flyin__trigger" data-flyin-target-id="#sauna" aria-controls="sauna" aria-expanded="false" aria-haspopup="dialog">
            <span class="status-light__circle"><span class="status-light__circle-inner" aria-label="hoch"></span> </span>
            <span class="status-light__text  d-none d-md-inline-block">Occupancy rate sauna</span>
            <span class="status-light__text d-md-none">Sauna</span>
            <span class="icon icon-arrow-right status-light__arrow"></span>
        </button>
    </div>
</div>
The aria-label of one of the spans within the buttons looks like the ideal candidate to get each area’s occupancy information. The problem is that it’s hard-coded and in no way connected to the actual occupancy. Poor blind people.
The reliable part is the CSS class on the button element that is also used for styling (e.g. status-low). So I need something to extract an HTML attribute value, and map those values to something numeric I can use for statistics.
CSS selectors only target elements, so I need to target the attribute using XPath. Scraping is a pain, so I vibe-coded a minimalist Python script to fetch the page and extract each area’s selector for occupancy information, and had the script push it to Prometheus as a metric.
Now, hold on, Chris. Don’t you usually try to be minimalist? A small Python script sounds fine and not like overkill, but Prometheus?
I already have a VictoriaMetrics setup in my network for monitoring home infrastructure, which provides a Prometheus-compatible interface in vmagent. Using existing infrastructure means that I don’t have to add something new to the picture. In that sense, it’s minimalist.
Running the script in a cron job every 10 minutes (I’m not a monster who constantly hammers their web server), I get some nice info in Grafana:
That would be enough for me, but I also have friends who like going there, and what’s more noble than helping friends?
Making it accessible🔗
My go-to domain registrar happened to have a sale on .at domains (just 6 Euros for a year instead of 36!), so I went for paracelsusgood.at. Bad sounds like something negative, although it just means “bath” or “pool” in German. It’s still a great opportunity to make a pun that I can’t pass up (because this site is about having a good visit at Paracelsusbad).
I quickly generated a logo with the font Comic Sans MS to show how little serious this is, and wrote down the info about when scheduled events are happening that lead to blocked resources in the pool.
Visualizing occupancy🔗
Although the Grafana visualization is nice to see progress over time, it’s harder to find a good time to go for a given point in time during the week.
So, I vibe-coded another cron job that queries metrics from Prometheus and uses that data to build an aggregated heat map that splits up each day into 10 minute slots. To save space, I’m only showing the hours during which the place is actually open.
Time zones weren’t considered by the agent out of the box, so I had to be explicit about that.
The result is somewhat ugly, but utilitarian:

Each area (pool and sauna) gets its own SVG, which I slapped into paracelsusgood.at unceremoniously.
In summary🔗
- One cron job scrapes occupancy data from the official website and writes it to Prometheus.
- Another cron job queries long-term data from Prometheus and distills it into an SVG.
- The same job uploads the SVG from the Raspberry Pi that does the work to a beefy server in a data center that I use for my publicly visible needs.
- The website serves the SVGs with caching headers that are in line with the update frequency.
Where’s the code?🔗
I don’t really want to publish AI slop, because it’s good enough for me, but I don’t want to bother with making it good enough for the public. It takes maybe half an hour of prompting and iteration to do this yourself, so there is no noteworthy shareable value.
How about analytics?🔗
Screw that - I ain’t putting no trackers on my site. I drop the last octet in my access logs to anonymize them, so my visitor statistic looks like:
sudo cat paracelsusgood.access.log | cut -d ' ' -f 1 | sort | uniq | wc -lIt doesn’t really tell much, though, because I only retain anonymized data for up to 7 days.
Possibilities for the future🔗
Once I’ve collected a decent amount of data, there are some opportunities to expand upon this:
- Weigh recent data more heavily to account for seasonal changes.
- Try to get weather data into the mix, which is particularly interesting for sauna visits and pool utilization during summer months.
- Train a neural net on occupancy (and weather) data to run prediction based on current weather and the past few days’ worth of occupancy.
- Expose historic scraping data for the enjoyment of others.
Let’s see about that once I have more data.